LGC Maine Standards Data Reduction Report Explained
Peer Group Analysis
- Participation
- Peer Statistics Table
- Percent Difference versus Peer Mean Graph
- Peer Comparison Table
- Applied Limits
- Insufficient Data
- Additional Information
Participating in LGC Maine Standards' Peer Group Analysis
With MSDRx Infinity you will be automatically included in and receive Peer Group Analysis from LGC Maine Standards, you just need to select the Manufacturer's Reagent Description abbreviation (i.e. ALB2, ALBP, ALBm, etc.) when processing in the new system or when you fill out your data submission form. This is the only information needed to ensure that your results are included in, and are compared to, the proper peers.
Peer Statistics Table

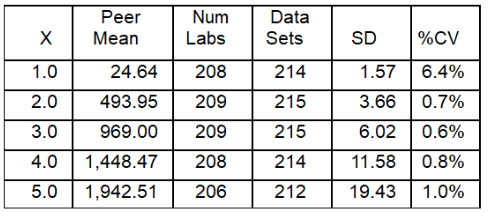
Displays the statistical information for your peer group. Statistics provided are the peer mean, the number of labs in your peer group, the number of data sets included in the peer, the Standard Deviation of the peer mean and the % Coefficient of Variation (% CV) of the peer mean.
The number of labs in your peer group and the number of data sets may vary per level depending upon the results reported by level from each customer.
Percent Difference vs. Peer Mean Graph
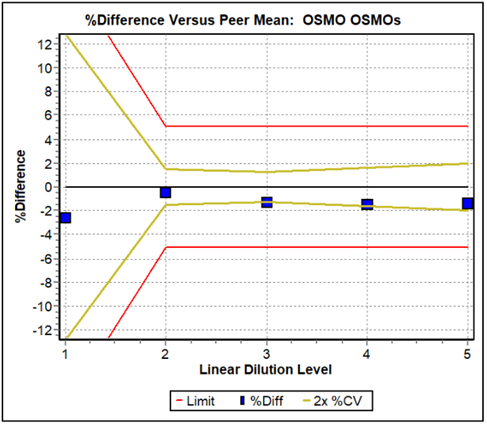
Displays your mean recovered values as compared to peer means at each linear dilution level. Your mean results are plotted as a percent difference from the peer means.
The red lines on the graph represent the allowable error for each level.
The yellow lines represent two times the percent Coefficient of Variation for each level.

This display makes it easy to visually see your deviation versus peer means.
Peer Comparison Table
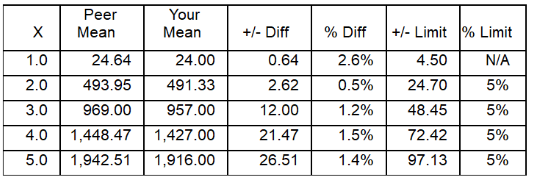
Displays your mean values for each linear dilution level as compared to the peer means. ‘+/- Diff’ is the absolute difference between your mean value and the Peer Mean. ‘% Diff’ is the percent difference between your mean value and the Peer Mean for each ‘Effective X’ value.
An evaluation of the deviation from the peer mean is also provided. The ‘+/- Limit’ and the ‘% Limit’ are the allowable absolute and percent limits, respectively, around your mean values.

Applied Limits
Fifty percent of the total allowable error, as defined by CLIA (42 CFR 493) and/or other published industry accepted standards, is used in Peer Analysis.

The ‘+/- Diff’ and ‘% Diff’ are compared to the allowable limits at each Effective X value to determine acceptability of your results as compared to your peers. Most allowable error limits are an absolute value and a percentage, whichever is greater. If the difference is greater than the limits set, the difference will be bolded with a ‘**’ flag.
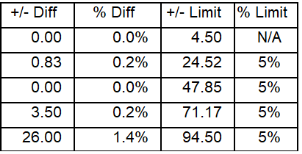
In the case of the GLU shown here, the allowable error limit is 3.00 mg/dL or 5%, whichever is greater. For Effective X values 2.0 through 5.0, 5% of the target value is greater than 3.00 mg/dL, so a limit 5% is applied. When the percent limit is applied, the ‘+/- Limit’ column will display the calculated absolute limit around your mean.
In the GLU example, the absolute limit of 3.00 mg/dL is applied to Effective X 1.0; the ‘+/- Diff’ is less than 3.00 mg/dL. For X values 2.0 through 5.0, the 5% limit is applied and the pass/fail indication is displayed in the ‘% Diff’ column. In this case, all results are within allowable limits, so none of the actual differences are flagged.
Insufficient Data for Peer Analysis
In some cases there may be insufficient data available to provide Peer Group statistics for a particular analyte. This can occur if the peer data does not pass a statistical check, or if there are fewer than 10 labs reporting data for a particular analyte/method. The statement “No Peer Data Available” will be displayed over the Peer Statistics and Peer Comparison Tables and no % Difference plot will be displayed.
However, if any peer data is available, you will receive a report detailing the Peer Minimum, Peer Median and Peer Maximum for each linear dilution level as well as a comparison of your mean to the Peer Median. In this instance, no % Difference plot will be displayed.
Completed reports with partial or no peer data can be updated once more peer data is available by looking up the submission and clicking "Refresh Peer" on the Submissions Review page.
Additional Information
For information on the calculations used in LGC Maine Standards Data Reduction Linearity and Peer Group Analysis, please see this Data Reduction Method Explained.
For information on Total Allowable Error Limits please see:
